Technical Levels
|
SUPPORT 1 |
SUPPORT 2 |
RESISTANCE 1 |
RESISTANCE 2 |
| GOLD |
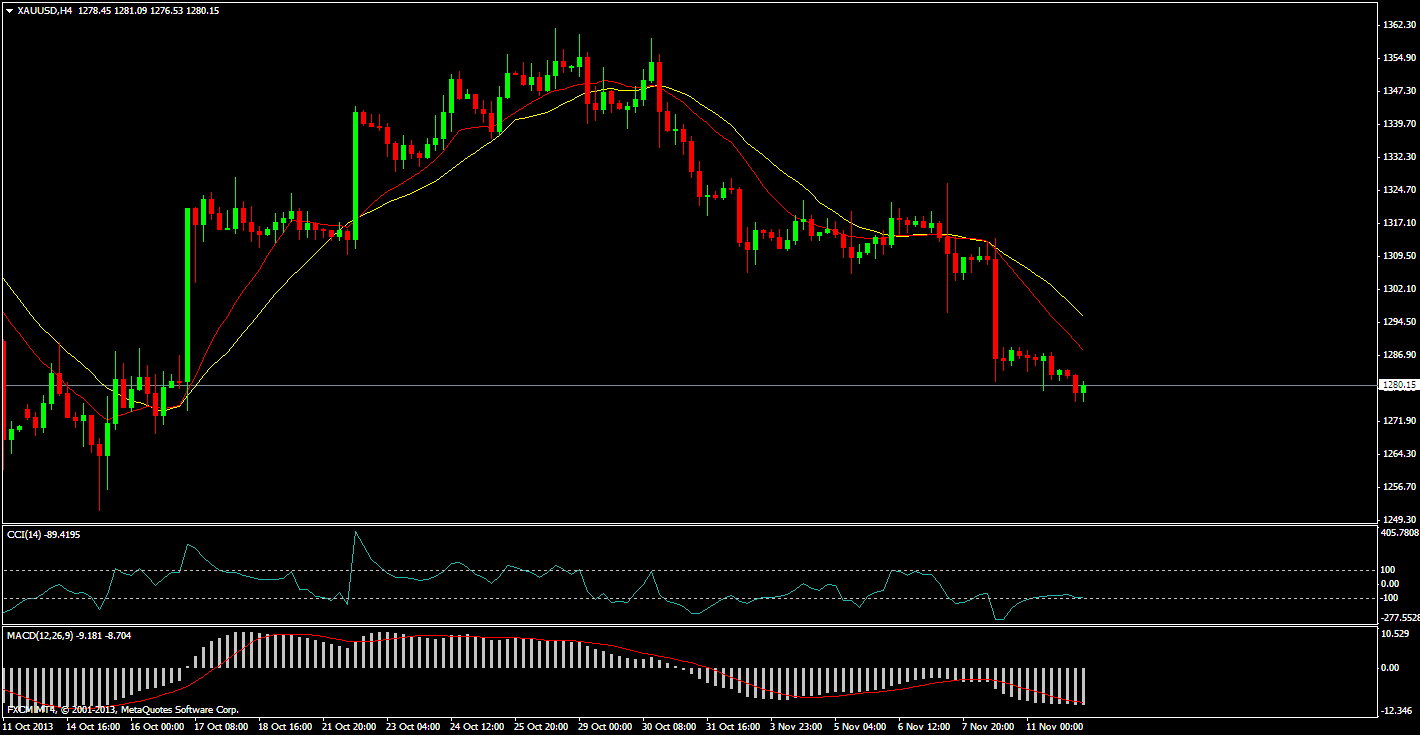
1294 |
1280 |
1324 |
1340 |
| SILVER |
21.34 |
21.04 |
21.98 |
22.32 |
| COPPER |
3.2301 |
3.2118 |
3.2621 |
3.2758 |
| CRUDE |
93.56 |
92.92 |
95.07 |
95.94 |
Commodity Contract S3 S2 S1 R1 R2 R3
Silver opened the day unchanged at 21.79/21.84 and traded alongside gold throughout the day, touching a low of 21.36/21.41 after the GDP data. A slow recovery throughout the remainder of the session left the metal to close at 21.63/21.68.
Silver closed lower today at 21.68. It is still holding the daily uptrend, in place since late June, which comes in right at 21.00. However, the risk is still lower, for a test of the 20.50 low from October 15th. Resistance is in the low 22’s, which have held silver in for the past 5 sessions.
The gold-silver ratio traded slightly lower at 60.36. Support is at the recent low at 58.62 and resistance is at this week’s high at 60.86.
Silver rose as weakness in rupee supported amid growing speculation the U.S. was moving closer to taking military action against Syria’s government.
An early end to stimulus could hurt precious metals by drawing investors away from non-interest-bearing assets.
Holdings at ishares silver trust gained by 44.99 tonnes to 10600.69 tonnes from 10555.70 tonnes.
GOLD
Erratic trade prior to our open after the ECB cut its benchmark interest rate to 0.25 percent. Gold opened the day at 1316.00/1317.00 and quickly touched a high of 1317.50/1318.50. The metal retreated after a better-than-expected GDP number fueled speculation the Federal Reserve will look to taper in December. After trading to a low of 1296.00/1297.00 the metal recovered to end the day at 1309.00/1310.00.
Gold closed lower today at 1309, but tested below 1300 on an intraday basis. There is support around 1300-1301, from psychological support at 1300 and from the 50% retracement of the 2008 to 2011 rally at 1301. The top of the recent range has been 1328, and our bias is for a move lower so long as we stay below the 1330 level. We look for a test of the 1251 low from October.
Gold climbed to the Life time High as Rupee dropped and political tension over Syria increased demand for the precious metal as a store of value.
Western powers told the Syrian opposition to expect a strike against Syria President Bashar al-Assad’s forces within days
SPDR Gold Trust, the world’s largest gold-backed ETF, said its holdings rose 0.10 percent, or 0.90 tonnes, to 921.03 tonnes
COPPER
On the
Comex division of the
New YorkMercantile Exchange, copper futures for December delivery traded at USD3.242 a pound during European morning trade, up 0.15%.
Copper prices traded in a range between USD3.238 a pound, the session low and a daily high of USD3.255 a pound.
The December contract fell to USD3.222 a pound on Wednesday, the weakest level since October 10, before settling at USD3.237 a pound, down 0.66%.
Copper prices were likely to find support at USD3.216 a pound, the low from October 10 and resistance at USD3.277 a pound, the high from November 6.
Copper futures traded near a four-week low on Thursday, as investors looked ahead to upcoming U.S. economic data and a policy meeting by the European Central Bank.
Copper crossed 500 mark as support seen due to weakness in rupee while a potential western strike on Syria made investor bets more cautious.
The economy of China is showing clear signs of stabilisation, helped by policy support and some improvement in global demand
In the US, recent data on durable goods, single family home sales and business spending on capital goods have been disappointing.
CRUDE
On the
New York Mercantile Exchange, light, sweet
crude futures for December delivery rose 0.19% to USD94.98 per barrel in Asian trading Thursday. The December contract settled higher by 1.53% at USD94.80 per barrel on Wednesday, crude’s best showing in a month.
Crude got a boost Wednesday after the U.S. Energy Information Administration said in its weekly report that U.S. crude oil inventories rose by 1.58 million barrels in the week ended Nov. 1, compared to expectations for an increase of 1.63 million barrels. Total U.S. crude oil inventories stood at 385.4 million barrels.
Oil futures traded higher during Thursday’s Asian session, building on gains from Wednesday’s session that were driven by supply concerns.
Crude rallied after a bigger than forecast drop in gasoline inventories calmed concerns over rising supplies.
The U.S. Energy Information Administration said in its weekly report that U.S. crude oil inventories rose by 1.57 million barrels
Prices have been on a downward trend in recent weeks amid concerns the recent U.S. government shutdown created a drag on economic growth.
Crude oil gained as tensions mounted in Syria, heightening geopolitical and crude oil supply risk in the Middle East.
Crude oil prices were also boosted as protesters stopped production at oil fields in Western Libya.
U.S. crude stocks rose last week while gasoline inventories declined and distillate stocks increased, API data showed.
Global Economic Data
| TIME |
DATA |
PRV |
EXP |
IMPACT |
| 7.00 P.M |
Unemployment Rate |
7.2% |
7.3% |
STRONG |
| 7.00 P.M |
Non-Farm Employment Change |
148K |
121K |
STRONG |
| 7.00 P.M |
Prelim UoM Consumer Sentiment |
73.2 |
74.6 |
STRONG |
| FF Alert |
Release date delayed by 7 days due to the US government shutdown; |
| Source |
Bureau of Labor Statistics (latest release) |
| Measures |
Percentage of the total work force that is unemployed and actively seeking employment during the previous month; |
| Usual Effect |
Actual < Forecast = Good for currency; |
| Frequency |
Released monthly, usually on the first Friday after the month ends; |
| Next Release |
Dec 6, 2013 |
Why Traders
Care |
Although it’s generally viewed as a lagging indicator, the number of unemployed people is an important signal of overall economic health because consumer spending is highly correlated with labor-market conditions; |
| Also Called |
Jobless Rate; |
Non-Farm Employment Change
| FF Alert |
Release date delayed by 7 days due to the US government shutdown; |
| Source |
Bureau of Labor Statistics (latest release) |
| Measures |
Change in the number of employed people during the previous month, excluding the farming industry; |
| Usual Effect |
Actual > Forecast = Good for currency; |
| Frequency |
Released monthly, usually on the first Friday after the month ends; |
| Next Release |
Dec 6, 2013 |
| FF Notes |
This is vital economic data released shortly after the month ends. The combination of importance and earliness makes for hefty market impacts; |
Why Traders
Care |
Job creation is an important leading indicator of consumer spending, which accounts for a majority of overall economic activity; |
Prelim UoM Consumer Sentiment
| Source |
University of Michigan (latest release) |
| Measures |
Level of a composite index based on surveyed consumers; |
| Usual Effect |
Actual > Forecast = Good for currency; |
| Frequency |
Released monthly, around the middle of the current month; |
| Next Release |
Dec 13, 2013 |
| FF Notes |
There are 2 versions of this data released 14 days apart – Preliminary and Revised. The Preliminary release is the earlier and thus tends to have the most impact; |
Why Traders
Care |
Financial confidence is a leading indicator of consumer spending, which accounts for a majority of overall economic activity; |
| Derived Via |
Survey of about 500 consumers which asks respondents to rate the relative level of current and future economic conditions; |
| Also Called |
Reuters/University of Michigan Consumer Sentiment; |