Archive for July, 2014

FOREX Technical Outlook For 31 July

Posted: July 31, 2014 in Forex

EUR/USD
EUR/USD pair did fall during the course of the day on Wednesday, EUR-USDbut bounce significantly in order to form a bit of a hammer. We continue to hang about the 1.34 level, and ultimately we believe that the real support is below, and much closer to the 1.33 handle. With that, we are looking to sell any rallies, and think that this pair will continue to be negative for the time being. However, we recognize that the nonfarm payroll numbers come out on Friday, so we could have a bit of slow trading during the session today.
GBP/USD
The GBP/USD pair fell during the course of the day on Wednesday,GBP-USD but bounced back above the 1.69 level in order to form a bit of a hammer. That being the case, it appears the market could make another attempt to reach the 1.70 handle, but it is not until we get above that level that we are comfortable buying. As far selling is concerned, if we can sustain a move below 1.69, it’s very likely that this pair does the 1.67 handle. Ultimately though, we do believe that the British pound will get some buying pressure soon.
AUD/USD
The AUD/USD pair initially fell during the session on Wednesday, AUd-Usdbut as you can see found enough support near the 0.93 handle in order to turn things back around and show a bit of support towards end of the day. Because of this, we feel that the market should continue to bounce from here, but right now don’t have the reason that we need to start buying. Ultimately, we think this market will continue to try to fight and of buying pressure to head the 0.95 handle, and perhaps even break through.
USD/JPY
The USD/JPY pair shot straight through the atmosphere during the day on Wednesday, USD-JPYas the US GDP numbers came out much stronger than anticipated. Because of this, the US dollar gained everywhere, the Japanese yen been no different. The 103 level was the significant resistance barrier that the market has been fighting with for some time now, and as a result we feel that the market should probably pull back from this area first, especially considering that the nonfarm payroll numbers are coming out on Friday.
Data Update for 31st July 2014

Time Currency Impact Particular Actual Forecast Previous
4:31am GBP GfK Consumer Confidence -2 2 1
7:00am AUD High Building Approvals m/m -5.00% -1.00% 10.30%
AUD Import Prices q/q -3.00% -1.40% 3.20%
AUD Private Sector Credit m/m 0.70% 0.40% 0.40%
JPY Average Cash Earnings y/y 0.40% 0.70% 0.60%
10:30am JPY Housing Starts y/y -9.50% -11.20% -15.00%
11:29am GBP Nationwide HPI m/m 0.10% 0.60% 1.00%
11:30am EUR German Retail Sales m/m 1.30% 1.10% -0.60%
12:15pm EUR French Consumer Spending m/m 0.90% 0.30% 0.70%
1:25pm EUR German Unemployment Change -12K -5K 7K
1:30pm EUR Italian Monthly Unemployment Rate 12.30% 12.60% 12.60%
2:30pm EUR High CPI Flash Estimate y/y 0.40% 0.50% 0.50%
EUR Core CPI Flash Estimate y/y 0.80% 0.80% 0.80%
EUR Unemployment Rate 11.50% 11.60% 11.60%
EUR Italian Prelim CPI m/m -0.10% 0.10% 0.10%
5:00pm USD Challenger Job Cuts y/y -20.20%
6:00pm CAD High GDP m/m 0.30% 0.10%
USD High Unemployment Claims 303K 284K
USD Employment Cost Index q/q 0.50% 0.30%
7:15pm USD Chicago PMI 63.2 62.6
8:00pm USD Natural Gas Storage 92B 90B

Market Review for KLCI:
Malaysian stocks opened on a mixed note at 1884.08 and turned slightly lower at midday today in active trading, with interest seen in selected heavyweights and penny stocks.

KLCI

KLCI Day Performance
Open 1884.08
High 1886.39
Low 1877.51
Close 1878.34
Change(Points) 1.00
% Change 0.05%
Volume 2117.5M
Rise 461
Fall 408
Unch 1401

Market forecast for KLCI:
Market has lead by PPB, GENM, KLCC, AXIATA and DIGI, rest share prices has taken up correction by maintaining an uptrend. Prices might open in between 1879-1880.

KLCI LEVELS
Support 1 Support 2 Support 3 Resistance 1 Resistance 2 Resistance 3
1869 1860 1845 1888 1898 1913

Technical indicators:
RSI stood below the centre line at 48.675 with its CCI at -16.260. Difference line of MACD performed at -1.218 below its signal line which performed at 0.110.

Top Gainers Top Losers
Scrip Name CMP %change Scrip Name CMP %change
PPB 15 2.74 FGV 4.1 -1.68
GENM 4.35 1.64 TM 6.3 -1.1
KLCC 6.45 1.26 MAXIS 6.67 -0.89
AXIATA 6.94 0.73 IHH 4.71 -0.84
DIGI 5.73 0.7 PETDAG 18.94 -0.53

Economic Factors:

  • The Malaysian Automotive Association had on July 23 revised upwards its total industry volume (TIV) forecast for this year to 680,000 units from the earlier target of 670,000 units.
  • Bina Puri Holdings Bhd, confident of its future growth, says it is bullish to end the current financial on a firm note despite sentiment being impacted by the delay in handing over the Kuala Lumpur International Airport 2 (klia2) project.
  • Malaysian banks given new threats to earnings growth, despite interest rates hike.

Market Review for STI:
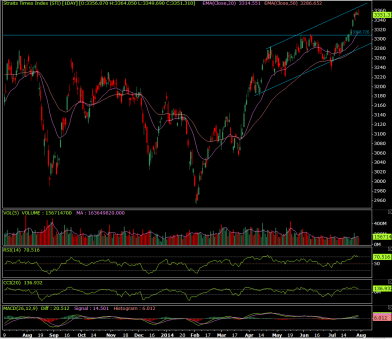
STI opened at 3356.07 today. The early trading was little bullish then market took the bearish move and close at 3351.310. Asia’s markets rose further on Wednesday, extending a recent rally, with a weaker yen boosting Tokyo while investors await the release this week of key US data and the Federal Reserve’s policy meeting.

Sti

STI Day Performance
Open 3356.070
High 3364.050
Low 3349.690
Close 3351.310
Change(Points) -4.770
% Change -0.14%
Volume 1649.6M
Rise 128
Fall 278
Unch 701

Market forecast for STI:
Prices are above the 20&50 days EMA. Though the market is not good the counters are not in a bullish move rather most of the active counters are in consolidation phase. In such case, the starting of the market can indicate the bullishness or bearishness for the same.

STI LEVELS
Support 1 Support 2 Support 3 Resistance 1 Resistance 2 Resistance 3
3320 3260 3240 3450 3470 3500

Technical indicators:
RSI is above the centre line and is at level 70.51 and CCI is at 136.93.

Top Gainers Top Losers
Scrip Name CMP %change Scrip Name CMP %change
OCBC Bank 9.91 1.54 SIA Engineering 4.69 -1.88
CapitaLand 3.32 0.91 ThaiBev 0.625 -1.58
UOB 24.05 0.29 CapitaMall Trust 1.98 -1.49
DBS 18.08 0.28 JSH 500 USD 35.81 -1.16
HongkongLand USD 6.73 0.15 Noble 1.42 -1.04
OCBC Bank 9.91 1.54

Important Factor for today:-

  • Singapore’s Oversea-Chinese Banking Corporation has acquired a total of 97.52% of the issued share capital of Wing Hang Bank, closing the US$4.95 billion ($6.15 billion) bid for the Hong Kong lender.
  • Keppel Land, Singapore’s third- biggest developer by value, made its maiden investment in the U.S. with a prime residential development in New York City.
  • Singapore’s City Developments and Australia’s Stock land Group are considering bidding for Leighton Holdings’ $7 billion ($8.7 billion) residential and commercial property portfolio, a leading Australian newspaper reported on Tuesday.
  • Singapore’s central bank announced new proposals to regulate financial benchmarks, in the wake of a series of scandals around the world involving traders manipulating Libor and other key rates.

EUR/USD
The EUR/USD pair fell during the course of the week, clearing the 1.35 level. It now appears that the selling momentum is picking up, and heading down towards the 1.33 level.Eur-Usd The 1.33 level as you can see is marked on the chart as support, and we feel that the buyers could step back into the marketplace at that area. Nonetheless, it does appear that in the meantime we are going to continue falling, and a break below the 1.33 level would be very bearish. Because of this, we don’t have any interest in buying.
Forecast
Market should continue to go lower. The 1.33 level below should be supportive though, and as a result we think that’s what the market is going to target. Ultimately, the market will probably bounce from there, rally should continue to be a selling opportunity, unless of course we get back above the 1.3550 level, which would show a significant break of resistance.
AUD/USD
The AUD/USD pair tried to rally during the course of the week, but found the area at the 0.8450 to be far too resistive to get above. Aud-UsdTherefore we pushed the market back down to form a shooting star. However, the market has been going sideways for some time so we believe that the market should eventually break out to the upside as the persistence should pay off. Above the 0.95 level, we are buyers, but in the meantime we are on the side lines.
Forecast
Technically, the sell-off last Thursday and Friday confirmed .9469 as a potentially bearish secondary lower top with .9504 the main top. A trade through .9328 will confirm the double-top formation. The main range is .9229 to .9504 This zone has provided support twice in July. Making it an important area to watch for support and technical bounces to the upside.
GBP/USD
The GBP/USD pair fell during the course of the week, breaking through the 1.70 handle. However, there is significant support all the way down to the 1.69 level, which could bring the buyers back into the marketplace as we are most certainly still in an uptrend. Gbp-UsdThe support at that area should send market back to the 1.72 handle though, and perhaps even the 1.75 level given enough time. Don’t really have any interest in selling this market, at least until we get below the 1.67 handle which would show a significant breakdown in the upward momentum.
Forecast
This market would probably head down to the 1.67 handle. Ultimately, the market looks more bullish at the moment, but we need to see a supportive candle in order to go long.
USD/JPY
The USD/JPY pair bounced during the week, to continue the consolidation that we have seen for some time. Usd-JpyWith that, we believe that the marketplace should continue to bounce around between the 101 and 103 levels, and as a result we don’t really have much of a play as far as long-term traders are concerned. With that, we believe that it is not until we break above the 103 level that we can start buying for the longer term. As far selling is concerned, we have to break down below the 100 level before we would consider that.
Forecast
Shooting star suggests that the market is going to pull back into the consolidation area, so we are looking for a pullback in order to buy supportive candles below. We believe that the 101 level should continue to be supportive, so we have no interest in selling the signal, and believe that it is simply a sign that we are continuing to try to build up momentum.
Data Update for 28th July to 1st Aug 2014

Date Time Currency Impact Particular Forecast Previous
Mon Jul 28 7:30pm USD High Pending Home Sales m/m -0.20% 6.10%
Tue Jul 29 7:30pm USD High CB Consumer Confidence 85.5 85.2
Wed Jul 30 All Day EUR High German Prelim CPI m/m 0.20% 0.30%
5:45pm USD High ADP Non-Farm Employment Change 234K 281K
11:30pm USD High FOMC Statement
Thu Jul 31 7:00am AUD High Building Approvals m/m 0.20% 9.90%
2:30pm EUR High CPI Flash Estimate y/y 0.50% 0.50%
6:00pm CAD High GDP m/m 0.30% 0.10%
USD High Unemployment Claims 306K 284K
Fri Aug 1 6:30am CNY High Manufacturing PMI 51.4 51
7:00am AUD High PPI q/q 0.70% 0.90%
7:15am CNY High HSBC Final Manufacturing PMI 52 52
9:00am JPY High BOJ Gov Kuroda Speaks
2:00pm GBP High Manufacturing PMI 57.2 57.5
6:00pm USD High Non-Farm Employment Change 230K 288K
USD High Unemployment Rate 6.10% 6.10%
7:30pm USD High ISM Manufacturing PMI 56.1 55.3

GOLD
Gold dropped below $1300 round figure mark also representing 100-day SMA support and is now hovering around 50% Fib. retracement level June-July 2014 up-swing. The $1290-80 zone, comprising of 100-day, 200-day SMAs and 50% retracement level, seems to continue acting as immediate strong support. A break below this immediate strong support now seems to open room for a further decline towards lows tested in June 2014, $1250-40 region. Meanwhile, a move back above 200-day SMA support turned immediate resistance area near $1300-1305, also coinciding with 38.2% retracement level could possibly trigger some recovery towards $1320-25 zone, a major upside resistance also coinciding with 23.6% retracement level. Only a decisive move back above this major resistance would now strengthen the case of further near-term appreciating move for the metal. Should the metal manage to conquer $1320-25 major resistance, it seems more likely to clear July 2014 highs resistance near $1245-50 area and continue moving higher towards $1400 psychological mark resistance. Gold
Forecast
Gold gapped higher at the open on Friday, but essentially went back and forth during the course of the day, meandering around the $1300 handle. We believe that there is a significant amount of support just below though, so a move back above the $1300 level for any significant amount of time should be a nice buying opportunity as the market should continue to go higher to the $1350 region. As far selling is concerned we have no real interest in selling this market, as a result we are essentially “buy only.”
SILVER
After failing to clear a very strong resistance near $21.00-21.20 zone, the white metal on Thursday dropped sharply and nearly tested the $20.00 psychological level. The metal, however, is witnessing some relief on Friday and is currently hovering around 38.2% Fib. retracement level of its up-swing from lows tested in May to high touched in July 2014. On the immediate upside 20.70 region seems to provide immediate resistance for the metal. However, major trend defining resistance on the upside is pegged near $21.00-21.20 zone. A decisive strength above this major resistance seems to provide further boost and lift the metal immediate towards $22.00 round figure mark resistance. Meanwhile, on the downside, $20.00 psychological mark, representing 50% Fib. retracement level and also comprising of a confluence between 50-day and 200-day SMA, seems to protect immediate downside for the metal. SilverA drop below this immediate strong support might negate the possibilities of any further up-move for the white metal and the metal could immediate drop towards 61.8% retracement level support near $19.70-19.60 zone.
Forecast
Silver bounce slightly during the day on Friday, essentially doing nothing but showing that there is still upward pressure in the market. The area that we are in right now is a necessarily important, so if we drift down to the $20 area, it wouldn’t exactly be a surprise as there is much more support there. Nonetheless, we have much in selling this market so we are looking for supportive candle in order to start buying again. Because of this, there is no selling opportunity in this market, and we would ignore negative signals.
CRUDE
Crude fell during the course of the day on Friday, but as you can see found enough support at the $101 level to turn things back around and form a nice-looking hammer.Crude The top of the hammer is of the $102.50 handle, so we can get above there we feel that the market should attack the 103.50 level, and then possibly go higher than that and send the market to the $106.50 handle.
Forecast
Because of this, we are very bullish of this market and we do not believe that you can sell this market until we break down below the $99 level, something that looks very unlikely. With that, and the fact that we have formed the hammer on Friday, we believe that the market should continue to go higher given enough time, and it will more than likely be choppy on the way up to the highs again, and beyond there we suspect of this market will go to the $110.00 handle.
DAY’S RANGE FOR 28th JULY

COMMODITY S1 S2 R1 R2
GOLD 1295 1285 1312 1322
SILVER 20.20 19.60 21.20 21.70
CRUDE 101.20 100.30 102.40 102.90

Weekly wrap of STI:
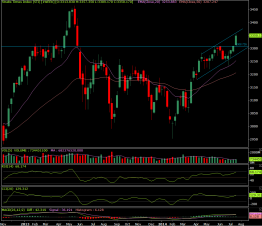
Straits Times Index up 2.40 points to 3,357.11 today .Asian markets rose as an index of Chinese manufacturing activity hit an 18-month high in July, boosting hopes for the world’s number two economy, as concerns over the Ukraine crisis eased. This week started with the breakout seen from the strong resistance level of 3308.72 and the market was up through the week. Open of the week was observed at 3313.83, close was at 3340.42.STI

STI Day Performance
OPEN 3313.83
HIGH 3357.35
LOW 3309.17
CLOSE 3350.17
CHANGE (In Points) 29.89
% CHANGE 0.894

Market Forecast for week ahead:
With the ease over Ukraine crises the market took a good move this week. We may expect that the market will take correction the coming week and can be bearish for some days in a week but may end bullish breaking this week’s high.
Technical Indicators:
Relative Strength Index (RSI) is above the centre line showing bullishness in the market and is at 61.89.CCI is at 67.93. The prices are above 20 & 50 days EMA.

STI LEVELS
Support 1 Support 2 Support 3 Resistance 1 Resistance 2 Resistance 3
3250 3200 3150 3380 3450 3480

Macroeconomic factors:

  • Singapore home prices will probably declines as the government sticks with curbs, according to Keppel Land, signalling further losses for Asia’s second-most expensive housing market.
  • RESALE prices of public housing in Singapore fell 1.4 per cent in the second quarter compared to the preceding quarter.
  • Consumer Confidence in Singapore remained stable at 98 index points in the Q2 of 2014, falling by just one point from the previous quarter.
  • OFFICE rents and RETAIL rents in Singapore continued to rise, climbing 2.8 per cent in the second quarter following the 2.4 per cent increase in the first quarter of this year. Retail increased by 0.6% in Q2.
  • Singapore Exchange strengthens ties in India, opens liaison office in Mumbai on approval from the Reserve Bank of India.
  • Singapore Exchange (SGX) is pleased to welcome First Sponsor Group Limited to its Main board under the stock code of “ADN”.

Short term viewEUR/USD
The EUR/USD pair went back and forth during the session on Thursday, essentially settling nothing as we printed a neutral candle. The market still looks a very weak though, and as a result we favour selling at this point. We need to find the right resistant candle after an attempt at a rally, and then we will join the fray. Ultimately, we think this pair could go to the 1.33 handle. As for the upside, if we get above the 1.3550 level, we suspect that the market would then be heading back to the 1.37 handle.
Overall Trend
EUR-USDAfter reaching an 8-month low at 1.3437, the EUR/USD rebounded to put itself in a position to post a potentially bullish closing price reversal bottom. The move was triggered by better than expected Euro Zone Flash Manufacturing PMI data.
After rebounding from the low at 1.3437, the market surged to the upside after taking out a down trending resistance angle at 1.3450. Upside momentum drove the market through the previous low for the year at 1.3476, but the rally stalled at 1.3484.
A close over 1.3463 will put the market higher for the session and form a closing price reversal bottom. Based on the range for the week at 1.3548 to 1.3437, the first target is the pivot at 1.3493. This is followed by the June low at 1.3502.
If the momentum shifts dramatically to the upside then look for an eventual move into a down trending angle from the 1.3700 top at 1.3530 today.
Forecast
The EUR/USD is trading higher at the mid-session. The Forex pair turned the main trend to up on the hourly chart after taking out the last swing top at 1.3473.
If a secondary higher bottom forms inside 1.3437 to 1.3484 then look for a strong close. After taking out 1.3483 to 1.3494, the next level will be 1.3495. Overcoming this price will reaffirm the uptrend. Closing over 1.3463 will put the market higher for the day and form a closing price reversal bottom on the daily chart.

Time Currency Particular Actual Forecast Previous
11:30am EUR German PPI m/m 0.00% 0.10% -0.20%
3:30pm EUR German Buba Monthly Report
7:30pm EUR Consumer Confidence -8 -6 -8
8:00pm USD Crude Oil Inventories -4.0M -2.1M -7.5M
12:30pm EUR French Flash Manufacturing PMI 47.6 48.5 48.2
EUR French Flash Services PMI 50.4 48.9 48.2
EUR Spanish Unemployment Rate 24.50% 25.90% 25.90%
1:00pm EUR German Flash Manufacturing PMI 52.9 52.2 52
EUR German Flash Services PMI 56.6 54.7 54.6
1:30pm EUR Flash Manufacturing PMI 51.9 52 51.8
EUR Flash Services PMI 54.4 52.7 52.8
EUR Italian Retail Sales m/m -0.70% 0.40% 0.30%
11:30am EUR GfK German Consumer Climate 9 8.9 8.9
1:30pm EUR German Ifo Business Climate 108 109.6 109.7
EUR M3 Money Supply y/y 1.50% 1.10% 1.00%
EUR Private Loans y/y -1.70% -1.80% -2.00%
6:30pm EUR Belgian NBB Business Climate -6.5 -6.2

Market Review for STI:
SINGAPORE share prices opened lower today with the Straits Times Index down 1.79 points to 3,311.68. Hong Kong stocks rose 0.34 per cent in the first few minutes of trade as tensions over the crisis in Ukraine eased after pro-Russian rebels handed over two black boxes from a downed Malaysia Airlines jet.STI opened at 3311.68 and the close was observed at 3316.91.

STI

STI Day Performance
Open 3311.68
High 3321.62
Low 3309.27
Close 3316.91
Change(Points) +2.64
% Change +0.08
Volume 2086.6M
Rise 210
Fall 166
Unch 408

Market forecast for STI:
STI opened lower but closed higher following its uptrend. Though the day range is small but the trend is up which is expected to continue. We may expect that it will move in a range of 3310-3325.

STI LEVELS
Support 1 Support 2 Support 3 Resistance 1 Resistance 2 Resistance 3
3310 3300 3290 3325 3340 3350

Technical indicators:
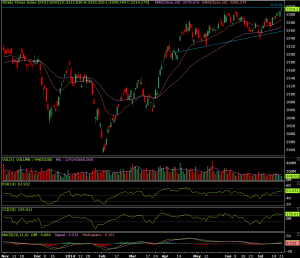
RSI is above the centre line at 64.80 and CCI is at 143.68 .Indicators are supportive to the bullish trend with index trading up of 20 & 50 days EMA.

Top Gainers Top Losers
Scrip Name CMP %change Scrip Name CMP %change
CapitaMall Trust 2.01 1.26 JSH 500 USD 35.8 -1.11
CityDev 10.47 1.16 Global Logistic 2.72 -1.09
StarHub 4.17 0.97 Olam Intl 2.46 -0.81
DBS 17.61 0.74 Ascendas Reit 2.32 -0.43
Sembcorp Marine 4.11 0.49 SGX 6.94 -0.43

Important Factor for today:-

  • SINGAPORE Exchange announced that its liaison office in Mumbai, India, has started operations following approval from the Reserve Bank of India.
  • Vard Holdings, the designer and shipbuilder of offshore and specialised vessels, today announced earnings for 2Q ended June (2Q2014) stood at NOK 105 million ($21 million).
  • First Sponsor Group is a developer and owner of residential and commercial properties in Chengdu and Dongguan, China, and also provides property financing services. The group is supported by prominent shareholders, Hong Leong Group Singapore and Tai Tak Estates Sendirian Berhad.
  • SUNTEC Reit announced a distribution per unit of 2.266 Singapore cents for its second quarter ended June 30, 2014, a slight increase from 2.249 Singapore cents a year ago.

Market Review for STI:
Singapore shares opened higher, with Straits Times Index at 3,313.83 in early trade, up 0.11 per cent. The equity markets had a good start today after Malaysian Airlines flight MH17 crashed near the Ukraine-Russia border. STI managed to end the day in positive territory at 3314.27 points. Closes higher than the previous day close. High and low was observed at 3320.25 & 3309.17.

STI

STI Day Performance
Open 3313.83
High 3320.35
Low 3309.17
Close 3314.27
Change(Points) +3.74
% Change +0.11%
Volume 1528.8M
Rise 203
Fall 181
Unch 401

Market forecast for STI:
STI formed a green doji indecisive candlestick which is indicating indecision for buying and selling. The next candle formation can confirm whether the index will move up or consolidate. We may expect a bullish trend as per indicators.

STI LEVELS
Support 1 Support 2 Support 3 Resistance 1 Resistance 2 Resistance 3
3300 3285 3270 3325 3340 3350

Technical indicators:
RSI is at 63.932, CCI is at 159.01 .MACD is at 4.15.

Top Gainers Top Losers
Scrip Name CMP % change Scrip Name CMP % change
Olam Intl 2.48 1.64 Jardine C&C 46.09 -1.14
CapitaLand 3.29 0.92 ST Engineering 3.74 -0.8
ComfortDelGro 2.58 0.78 SIA Engineering 5.1 -0.39
JSH 500 USD 36.2 0.69 Genting Sing 1.32 -0.38
SIA 10.55 0.57 Global Logistic 2.75 -0.36

Important Factor for today:-

  • The tourism receipt tally in Singapore rose to $6 billion in the first quarter of 2014, a five per cent increase on the same period last year.
  • Golden Agri-Resources, the Singapore-listed holding company of crude palm oil producer PT Sinar Mas Agro Resources and Technology (SMART), has invited Spain-based Compania Espanola de Petroleos (Cepsa) to produce and sell fatty alcohol.
  • Sembcorp Marine’s wholly-owned subsidiary Sembawang Shipyard has secured a Floating Storage Production Offloading (FPSO) conversion contract worth about $600 million from Saipem SA, France for the conversion of Two FPSOs for the Kaombo Project in Offshore Angola.
  • UOB’s economic-treasury research division says in a note today that these geo-political tensions could continue to negatively impact markets.
  • CapitaCommercial Trust (CCT) reported 2Q14 distributable income of S$64.1m – 7.6% higher YoY. This cumulates to an YTD distributable income of S$124.0m, which is within expectations and makes up 51.0% of our FY14 forecast.

Market Review for KLCI:
Malaysian stocks opened on a mixed note with KLCI at 1874.34. Share prices on Bursa Malaysia remained lower at mid-morning today, weighed on by weak buying sentiment. Local market sentiment remained cautious as fears about Portugal’s banking sector receded and investor attention turned to United States corporate earnings and monetary policy and China’s Q2 economic data. Trading sentiment was adversely impacted last Friday due to rising geopolitical tensions sparked by the downing of (Malaysia Airlines) MAS passenger airline MH17 and Israel’s ground offensive in Gaza. THE local bourse is expected to be jittery this week on the back of on-going world conflicts and the shock from the downing of Malaysian Airlines’ (MAS) Flight MH17 in eastern Ukraine.

KLCI

KLCI Day Performance
Open 1874.34
High 1876.83
Low 1867.34
Close 1868.64
Change(Points) -4.330
% Change -0.23%
Volume 2404.4M
Rise 400
Fall 451
Unch 796

Market forecast for KLCI:
Market is under selling pressure it might open tomorrow near 1868 level. As per the technical, prices are anticipated to continue the same.

KLCI LEVELS
Support 1 Support 2 Support 3 Resistance 1 Resistance 2 Resistance 3
1872 1862 1845 1895 1910 1916

Technical indicators:
RSI stood below the centre line at 38.715 with its CCI at -216.91. Difference line of MACD performed at 0.222 below its signal line which performed at 2.773.

Top Gainers Top Losers
Scrip Name CMP % change Scrip Name CMP % change
ASTRO 3.37 4.01 PETDAG 19.98 -3.57
GENM 4.26 1.43 MISC 6.38 -3.48
UMW 11.66 0.52 HLFG 17.04 -3.18
PBBANK 20.12 0.5 IHH 4.67 -2.1
KLCC 6.4 0.47 PETGAS 23.4 -1.6

Economic Factors:

  • The ringgit opened broadly higher against the US dollar and other major currencies today on renewed demand for the domestic currency.
  • The Malaysian rubber market closed marginally lower today, weighed on by the stronger ringgit.
  • Volatility spiked on Thursday after the tragedy of a downed Malaysian Airlines jet in Ukraine and the mounting death toll in Gaza and Israel interrupted the summer trading slumber. Still, the bears may have to wait a while to call the start of a correction. Uncertainly took over Wall Street Thursday as investors fled stocks, giving the S&P 500 its first decline of more than 1% in three months. The Volatility Index (VIX) posted its biggest one-day percentage increase since April last year, surging 32%. Volume jumped 20 % compared to the average so far this month.